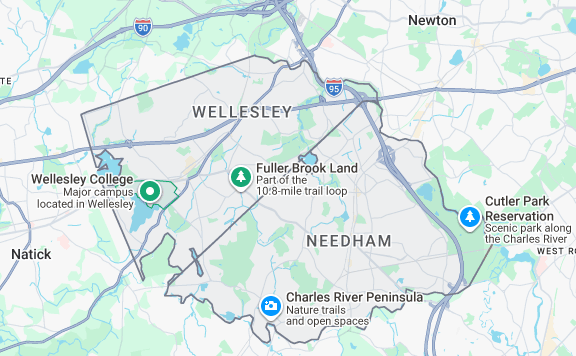
If you are a family shopping for a home west of Boston, there is a good chance you are weighing Wellesley against Needham. It is the most common comparison I hear in this market — probably three out of every five buyers I work with ask me to help them think through it. The two towns share a border, share school-district rankings in the top tier of Massachusetts, and share the daily commute into Back Bay on the same MBTA commuter rail line.
But for the first time in at least five years, the assumption most families bring to this comparison is wrong.
For most of the last decade, everyone shopping this part of MetroWest treated Wellesley as the more expensive town and Needham as the value play. That was true in 2022. It was true in 2023 and 2024. It was barely true in 2025. And in 2026 it has flipped entirely. Needham’s median single-family sale price has not just caught Wellesley — it has overtaken it, and by a meaningful margin.
I sell in both towns. I live in Wellesley with my family, and a significant share of my transactions happen in Needham. So this article is not a “which town is better” piece, because neither town is better. They are different, and the differences matter more now than they have in years. If you are moving to Wellesley, moving to Needham, or genuinely torn between the two, this guide walks you through what the data actually shows and how to make a decision that fits your family.
Here is what has changed, why it has changed, and what it means for you.
- The Headline: The 2026 Price Inversion
- The 5-Year Trendline That Proves It Is Not A Blip
- Why This Is Happening: A 2017 Wellesley Town Meeting Vote
- The Square-Foot Truth: Wellesley Still Charges More Per Foot
- What Is Actually For Sale Right Now
- Sale Velocity: Wellesley Has Slowed, Needham Has Not
- Schools: Both Are A+, The Choice Isn’t About Quality
- Commute: Both Have Commuter Rail, One Has More Options
- Lifestyle and Downtown: Two Different Personalities
- The Four Needham MLS Areas
- Condos: The Overlooked Entry Point for Both Towns
- Who Should Choose Wellesley, and Who Should Choose Needham
- Frequently Asked Questions
- Choosing Between Wellesley and Needham
The Headline: The 2026 Price Inversion
Let’s start with the number that made me pull five years of MLS data to check my own eyes.
Year-to-date 2026 (as of April 12), the median single-family sale price in Needham is $2,359,500. In Wellesley, it is $1,897,500. Needham is running $462,000 higher than Wellesley.
If you have been in this market for any length of time, that sentence should feel wrong. For most of the last decade, Wellesley was the more expensive town by a comfortable margin. In 2024, Wellesley’s median was $2,201,000 and Needham’s was $1,550,000 — a $651,000 gap in Wellesley’s favor. That was not an anomaly. That was the pattern.
In 24 months, the pattern reversed.
A few caveats before I go further, because I believe in being honest about data:
- Year-to-date 2026 is still thin — 34 Wellesley closings and 40 Needham closings through April 12. That is a real sample for a contrarian claim, but it is not a full year.
- Medians can be influenced by what happens to close in a given window. A handful of high-end sales in one town can pull the median meaningfully.
- I would not be writing this article on the 2026 numbers alone. But the 2026 numbers are not alone. They sit on top of a 5-year trendline that tells a clear story, which is the next section.
What I can say with confidence is this: something real is happening, it has been building for years, and in early 2026 it crossed a visible line that every family shopping these two towns deserves to understand.
The 5-Year Trendline That Proves It Is Not A Blip
Here is the median single-family sale price in both towns for the last five calendar years, pulled directly from MLSPIN:
| Year | Wellesley median | Needham median | Wellesley’s lead |
|---|---|---|---|
| 2022 | $1,803,000 | $1,455,000 | +$348,000 |
| 2023 | $1,865,000 | $1,350,000 | +$515,000 |
| 2024 | $2,201,000 | $1,550,000 | +$651,000 |
| 2025 | $2,085,000 | $1,975,000 | +$110,000 |
| 2026 YTD | $1,897,500 | $2,359,500 | −$462,000 |
Read that bottom row again. Needham is now $462,000 above Wellesley.
A few things jump out when you look at the full five years instead of a single quarter:
Wellesley’s median peaked in 2024. The town’s median sale price hit $2,201,000 in 2024, slipped to $2,085,000 in 2025, and has dropped to $1,897,500 in the YTD 2026 window. That is roughly a 14% drop over 24 months. In a high-value market like Wellesley, a 14% median shift is substantial.
Needham’s growth has been relentless. From 2022 to 2026 YTD, Needham’s median single-family sale price has climbed from $1,455,000 to $2,359,500. That is a 62% increase in four years. No other town in MetroWest has moved like that.
The crossover was not sudden. In 2025, Wellesley’s lead had already compressed to just $110,000 — essentially a tie in a two-million-dollar market. The 2026 inversion is the logical endpoint of a trend that had been narrowing every single year since 2023.
It is not a Wellesley problem — it is a Wellesley-specific shift. For context, here is where the four other MetroWest towns most commonly compared to Wellesley and Needham landed in 2026:
| Town | 2026 YTD median single-family sale price |
|---|---|
| Needham | $2,359,500 |
| Weston | $2,425,000 |
| Wellesley | $1,897,500 |
| Newton | $1,847,000 |
| Natick | $1,100,000 |
Needham is now the second-most-expensive town on this list, trailing only Weston — and Weston’s market moves on a handful of luxury estate sales per quarter. Among the four high-volume MetroWest towns that families actually compare when deciding where to live, Needham now has the highest median sale price.
That is a sentence I did not expect to write a year ago.
Why This Is Happening: A 2017 Wellesley Town Meeting Vote
When I first saw these numbers, my honest reaction was to assume it was a data artifact. But the trendline is too consistent, and the explanation turns out to be traceable to a specific piece of Wellesley local policy.
In 2017, Wellesley’s Annual Town Meeting adopted Article 46C — a new section of the Town Bylaw called the Historic Preservation Demolition Review Bylaw. It became effective in August 2017. The bylaw created a formal review process for any proposed demolition of a building that had been used as a dwelling, and it gave the Wellesley Historical Commission the authority to impose a 12-month delay on the issuance of demolition permits for any home the commission determined should be “preferably preserved.”
The context at the time is important. Wellesley’s teardown rate had become one of the most aggressive in Greater Boston. More than 600 homes had been torn down in Wellesley between 2007 and 2017. The Historical Commission chairman who championed the bylaw said openly at Town Meeting that Wellesley’s lack of a demolition delay had “lured many a developer to town to snap up teardown targets” and replace them with large new-construction homes on small lots.
The 2017 vote was Wellesley’s deliberate response. The town chose character preservation over teardown volume.
Needham has a demolition delay bylaw too — but Needham’s is a 6-month delay, not 12. As recently as March 2025, the Needham Historical Commission was publicly debating whether their 6-month window was long enough to meaningfully deter builders, with commissioners explicitly noting that it “often aligns too closely with permit timelines.” They have been discussing extending it for over a year. They have not done so.
Six months versus twelve months sounds like a small difference. For a family buying a home it is invisible. For a builder running a teardown-rebuild business, it is everything.
Here is the math from a builder’s perspective. When a builder acquires a teardown target, they carry that property at roughly 0.5% to 1% of value per month in property taxes, insurance, financing costs, and opportunity cost. On a $1.5 million Wellesley teardown acquisition, an extra six months of delay is $45,000 to $90,000 of dead carrying cost before construction can begin. On top of that, a six-month delay can push new-construction delivery out of a spring selling season and into the next one, which compounds the risk further. Needham’s Historical Commission itself has said, essentially, that 6 months is short enough that builders work around it. By implication, 12 months is long enough to change their calculus.
Now look at the timing.
- Wellesley’s 12-month delay became effective August 2017
- A typical new-construction teardown-rebuild project runs 18 to 36 months from land acquisition through permits, construction, and listing
- Builders who were deterred by the new Wellesley rule started looking for land elsewhere in 2018 and 2019
- The closest comparable town with a shorter delay was Needham
- New homes built by those redirected builders in the 2019 to 2021 window started hitting the Needham resale market in 2022 through 2024
- And Needham’s median sale price started its climb in exactly those years: $1,455,000 in 2022, to $1,550,000 in 2024, to $1,975,000 in 2025, to $2,359,500 in early 2026
The fit between the policy timeline and the market data is not perfect — nothing about real estate ever is — but it is strong enough to take seriously. And when you add in the active inventory data (coming in the next two sections), the picture becomes very hard to explain any other way.
I want to be clear: Wellesley made a legitimate choice in 2017. The town looked at what teardown-driven development was doing to its character and decided to trade some housing-stock turnover for the preservation of its existing neighborhoods. That was a real tradeoff, and plenty of Wellesley residents — including many of my clients — are glad the town made it. What has happened since is the cost side of that tradeoff starting to show up in the data. Needham has absorbed the builder activity that Wellesley chose to slow down, and Needham’s housing stock has refreshed faster as a result.
Whether that trade was worth it depends on what you value. Which is, in a way, what the rest of this article is about.
The Square-Foot Truth: Wellesley Still Charges More Per Foot
Here is where the story gets more nuanced than “Needham is now more expensive than Wellesley.”
The median sale price in Needham has overtaken Wellesley, but the price per square foot in Wellesley is still higher. Look at the 5-year trendline:
| Year | Wellesley $/sqft | Needham $/sqft | Wellesley premium |
|---|---|---|---|
| 2022 | $563.62 | $516.37 | +$47 |
| 2023 | $602.92 | $482.28 | +$121 |
| 2024 | $608.65 | $502.34 | +$106 |
| 2025 | $652.61 | $503.00 | +$150 |
| 2026 YTD | $605.68 | $544.37 | +$61 |
Wellesley has charged more per square foot than Needham every year for the last five years. That is still true in 2026. What has changed is how much more: a year ago Wellesley was $150 per square foot above Needham, today it is $61 above. The premium is compressing, but it has not disappeared.
So how can Needham’s median total price be higher when Wellesley’s price per foot is higher? The answer is the one you probably already suspect: Needham buyers are buying bigger and newer homes. Same dollars, more house. That finding lines up directly with the inventory data, which is the next section.
This is an important distinction to understand before deciding between the two towns, and it is the thing most generic “Wellesley vs. Needham” articles get wrong. Wellesley land is still the premium good. A Wellesley address, a Wellesley school district, and a Wellesley lot still commands a higher dollar per square foot than the equivalent in Needham. What has changed is what Needham is selling on top of that land: newer construction, with more square footage per transaction. Needham’s median is higher not because Needham dirt is now more valuable than Wellesley dirt — it is because a typical Needham sale now includes more and newer house.
If you are a buyer with a target price of $2 million and you want the most square footage and the newest construction you can get, the data says Needham. If you are a buyer who values the address, the tree-lined street, and the character of a 1920s colonial — and you are willing to accept an older and sometimes smaller home for it — the data says Wellesley. Both are rational choices. They just produce different outcomes.
What Is Actually For Sale Right Now
I pulled active single-family inventory in both towns as of April 12, 2026. Wellesley has 60 active listings. Needham has 53. That is roughly similar total volume, which is convenient because it means direct comparisons are fair.
The first thing that jumps out is what is for sale and what it was built.
Year built on active inventory:
| Era | Wellesley active | Needham active |
|---|---|---|
| Pre-1900 | 5 (8%) | 3 (6%) |
| 1900–1949 | 19 (32%) | 12 (23%) |
| 1950–1999 | 11 (18%) | 11 (21%) |
| 2000–2014 | 6 (10%) | 0 (0%) |
| 2015 and newer | 19 (32%) | 27 (51%) |
Median year built on Wellesley active inventory: 1969. Median year built on Needham active inventory: 2016.
That is the new-construction story in one sentence. Over half of Needham’s active single-family listings were built in 2015 or later. Only a third of Wellesley’s were. And note the 2000–2014 row: Needham has zero active listings built in that 15-year window. Every Needham home currently for sale that is not historic is essentially brand new.
This is exactly what the demolition-bylaw timeline would predict. Builders who would have been knocking down older Wellesley homes to build new construction in 2018, 2019, and 2020 went to Needham instead. Those homes are now hitting the market.
Price bands on active inventory:
| Price band | Wellesley active | Needham active |
|---|---|---|
| Under $1.0M | 2 | 8 |
| $1.0M – $1.5M | 12 | 7 |
| $1.5M – $2.0M | 4 | 14 |
| $2.0M – $3.0M | 15 | 13 |
| $3.0M – $5.0M | 16 | 10 |
| $5.0M and above | 11 | 1 |
| Total | 60 | 53 |
This table is where the abstract price-inversion story becomes concrete and actionable for buyers. Two things matter here:
In the $1.5M to $2M range — the sweet spot where a lot of MetroWest families actually shop — Needham has 14 active homes and Wellesley has 4. If your budget caps around $2 million and you want a single-family home in one of these two towns, Needham has three and a half times more inventory. That is not a subtle difference. That is a buyer who walks into Wellesley with a $1.8 million budget getting frustrated fast, and the same buyer walking into Needham having a genuinely productive house-hunting weekend.
In the $5M and above luxury tier, Wellesley has 11 active homes and Needham has 1. Wellesley still dominates the luxury estate market. If you are shopping at the top of the market and you want turnkey luxury, large lots, and established prestige addresses, Wellesley is still essentially your only option in this part of MetroWest. That has not changed.
So the buyer’s decision actually depends on where your price point sits:
- Under $1.5M: Needham has noticeably more inventory (15 active homes versus 14 in Wellesley, but skewed much more toward condos and smaller homes at the lower end).
- $1.5M to $3M: Needham is winning the inventory battle decisively at the lower half of this range. Wellesley has more at the top.
- $3M to $5M: Wellesley has a modest edge (16 to 10).
- Above $5M: Wellesley is essentially uncontested (11 to 1).
Sale Velocity: Wellesley Has Slowed, Needham Has Not
The other 5-year trendline worth looking at is days on market — how long homes are sitting before they sell.
| Year | Wellesley median DOM | Needham median DOM |
|---|---|---|
| 2022 | 14 days | 12 days |
| 2023 | 20 days | 25 days |
| 2024 | 19 days | 17 days |
| 2025 | 21 days | 27 days |
| 2026 YTD | 38 days | 30 days |
For four straight years, Wellesley homes sold as fast or faster than Needham homes. In early 2026, that flipped. Wellesley’s median days on market is now 38 — the slowest it has been in the entire five-year window, by a wide margin. Needham has barely budged, moving from 27 days to 30.
Combined with the median price drop in Wellesley and the median price gain in Needham, this is unambiguous: Wellesley’s market has materially softened in early 2026, while Needham’s momentum has held. Homes that would have sold in three weeks in early 2025 are now sitting for five or six weeks in early 2026. For sellers, that is meaningful. For buyers, it means there is more breathing room in Wellesley than there has been in years — and more competitive pressure in Needham than the “Needham is the cheaper option” narrative would suggest.
One more data point on market firmness. Here is the sale-price-to-original-list-price ratio for both towns over the same window — a measure of how much sellers are getting of their original asking price:
| Year | Wellesley | Needham |
|---|---|---|
| 2022 | 102.22% | 107.62% |
| 2023 | 100.00% | 96.66% |
| 2024 | 98.32% | 97.45% |
| 2025 | 97.56% | 98.94% |
| 2026 YTD | 97.22% | 97.01% |
Both towns have come off the post-pandemic froth, and in 2026 they are running neck-and-neck at about 97% of original list price. Both are still healthy seller’s markets by any historical standard — neither town is seeing meaningful price cuts on average — but neither is the overheated bidding-war environment of 2022.
Schools: Both Are A+, The Choice Isn’t About Quality
If you are moving to either of these towns, the schools are almost certainly part of why. And the honest answer is that both school districts are excellent, and the choice between Wellesley and Needham should not be about “which district is better academically.” They are peers.
Wellesley Public Schools rank among the top 15 districts in Greater Boston per Niche, earning an overall A+ rating. The district recently opened a brand-new $250 million high school campus in September 2025, and two brand-new elementary schools in 2024 — Hunnewell and Hardy — as part of a $400+ million facilities investment. Wellesley operates six neighborhood elementary schools. If you want to understand them in detail, I wrote a complete guide to every Wellesley elementary school that walks through each one.
Needham Public Schools also earn an A+ from Niche and consistently rank in the top 15 of Greater Boston. The district’s elementary schools, middle school, and high school have the same strong reputation for academics and community investment that Wellesley’s do.
If your decision comes down to “which district is objectively better,” you are asking the wrong question. Both are excellent. A better question is which district’s structure fits your family. Wellesley operates six smaller neighborhood elementary schools, which means your child likely walks to one of the smallest elementary buildings of any top-tier district in the state. Needham has a similar neighborhood-school model with five elementary schools of similar size. The difference is in the details — building age, specific programs, PTO culture — and those differences are worth visiting in person.
One practical note: if you are buying in Wellesley, your home address determines which of the six elementary schools your child attends, and the boundaries were redrawn in 2024. This is also true in Needham. Always verify your specific address through the district’s street lookup before making an offer.
Commute: Both Have Commuter Rail, One Has More Options
Both towns are on the MBTA commuter rail, but they sit on different lines.
Wellesley has three commuter rail stations on the Framingham/Worcester Line: Wellesley Square, Wellesley Hills, and Wellesley Farms. Trains from all three reach Back Bay in roughly 22 to 28 minutes. Having three stations across town means a meaningful share of Wellesley residents can genuinely walk to the train — it is one of the features that gives Wellesley its walkable feel. Wellesley also has strong road access via Route 9, Route 16, and I-95 / Route 128.
Needham has three stations on the Needham Line: Needham Heights, Needham Center, and Needham Junction. Service to Back Bay takes about 30 to 35 minutes. That is roughly five to ten minutes longer than Wellesley on the train, which matters to some commuters and does not matter to others. Needham also sits directly on I-95 / Route 128, which makes it one of the easiest MetroWest towns for anyone whose job is on the 128 corridor rather than downtown Boston.
For families whose commute is to downtown Boston, Wellesley has a slight edge on pure train speed. For families whose jobs are along Route 128 — think Waltham, Burlington, Needham itself, Natick, or Framingham — Needham is often the better fit because you are never more than a few minutes from the highway ramp.
A common question I hear is: how far is Needham from Boston? By road, it is about 15 miles to downtown — typically a 25 to 40 minute drive depending on traffic. By commuter rail, 30 to 35 minutes to Back Bay. It is comfortably within the range most families consider a reasonable Boston suburb.
Lifestyle and Downtown: Two Different Personalities
The two towns feel different even if you cannot articulate why on your first visit, and the differences show up most in the downtowns.
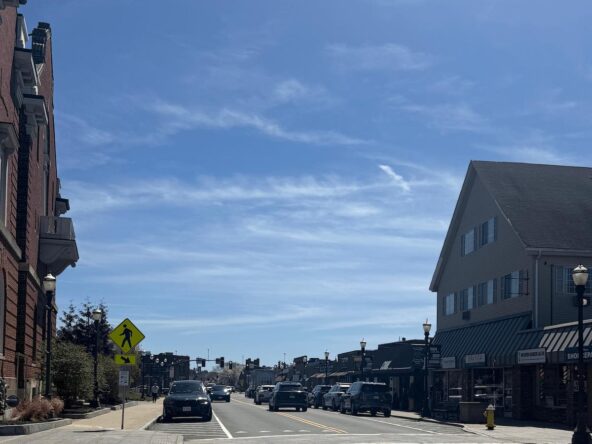
Wellesley has three commercial centers that locals actually use: Wellesley Square, Wellesley Hills, and Linden Square. Wellesley Square is the main one — a walkable village center with a mix of independent shops, restaurants, the public library, and the Wellesley Square commuter rail station. Linden Square is a more modern commercial development with an anchor grocery store, restaurants, and retail. Wellesley Hills has a small commercial strip along Route 16 with everyday conveniences. The overall feel of Wellesley is polished, established, and village-scale. If you want walkability and a sense that you can do your errands on foot on a Saturday, Wellesley Square delivers that better than almost any other suburb in MetroWest.
Needham has its own well-established downtown along Great Plain Avenue and Chestnut Street, with independent restaurants, coffee shops, a library, and a civic center that draws residents from across the town. Needham’s downtown is slightly more compact than Wellesley Square, but it has seen significant revitalization over the last decade. The town also has strong access to the Charles River Reservation and substantial conservation land. The feel is a bit more residential-suburban than village-walkable, though the core of downtown Needham is genuinely walkable.
Both towns have strong youth sports programs, strong library systems, active recreation departments, and engaged parent communities. Both have town beaches and conservation land. The lifestyle differences are subtle and mostly come down to which downtown you want to pop into on a Saturday morning.
My honest take after working with families in both towns: if you want “classic New England walkable village,” Wellesley Square is a more complete version of that. If you want “modern suburban town center with everything you need,” Needham downtown fits the bill and often feels a little more relaxed and less self-consciously affluent.
The Four Needham MLS Areas
One question I get from families relocating from out of state is whether Needham has distinct neighborhoods the way Wellesley does. The answer is a qualified yes. Needham has four formally designated MLS areas: Birds Hill, Charles River Village, Needham Heights, and Needham Junction. Wellesley, by comparison, has six formal MLS areas, and locally known neighborhoods well beyond that — I cover them in detail in my guide to the best neighborhoods in Wellesley.
Here is where I have to be honest with you: the area-level data for Needham is thin. Listing agents in Needham often do not tag the specific MLS area when they list a property — many just enter “Needham” as the location and leave the area field blank. The result is that pulling 5-year median sale data for each of the four Needham areas produces samples of one, two, or three closings per year per area, which is far too small to draw any meaningful conclusions from. A single transaction in a given year can swing the reported median by a million dollars or more.
What I can tell you with confidence is that Needham is a town of distinct neighborhoods in the way that locals experience it, even if the MLS data does not cleanly separate them. Families shopping in Needham should plan to spend a weekend driving through the town rather than relying on area-level data alone. When I work with Needham buyers, I typically walk them through specific streets and pockets based on what they are looking for, because the town-wide data rolls up cleaner than the area-level data ever will.
If you want a Needham-specific neighborhood deep dive, I am working on one — it will be published as a standalone guide soon.
Condos: The Overlooked Entry Point for Both Towns
Most of this article has focused on single-family homes because that is where most of the action and most of the data lives. But condos and townhomes are a real entry point to both towns, particularly for downsizers, first-time buyers wanting to plant a flag in one of these school districts, and empty-nesters.
Here is the 5-year median condo sale price for both towns:
| Year | Wellesley condo median | Needham condo median |
|---|---|---|
| 2022 | $1,025,000 | $752,500 |
| 2023 | $975,000 | $1,180,000 |
| 2024 | $2,535,000* | $807,500 |
| 2025 | $1,226,000 | $1,423,500 |
| 2026 YTD | $1,031,500 | $1,020,000 |
The 2024 Wellesley condo median reflects a small number of transactions and includes several high-end sales; it is not representative of typical Wellesley condo pricing and should be read as statistical noise.
Condo closing volumes are much smaller than single-family — both towns typically see only 40 to 80 condo closings per year — so these medians move around more year to year. But the 2026 picture is clean: Wellesley and Needham condos are running almost identically in total price, at about $1.02 million median. That is genuinely useful information for a downsizer or a first-time buyer who is weighing the two towns, because it means the condo decision is not primarily about price.
The per-square-foot story is different. Wellesley condos sold at a median $767 per square foot in 2026 YTD. Needham condos sold at $548. Wellesley condos are smaller and more expensive per foot; Needham condos are bigger and cheaper per foot. Same pattern as the single-family story. You are paying for walkability and a Wellesley Square address when you buy a Wellesley condo. You are paying for more living space when you buy a Needham one.
Both are valid. The question is which one fits your life.
Who Should Choose Wellesley, and Who Should Choose Needham
Here is my honest framework for families who are torn between the two.
Choose Wellesley if:
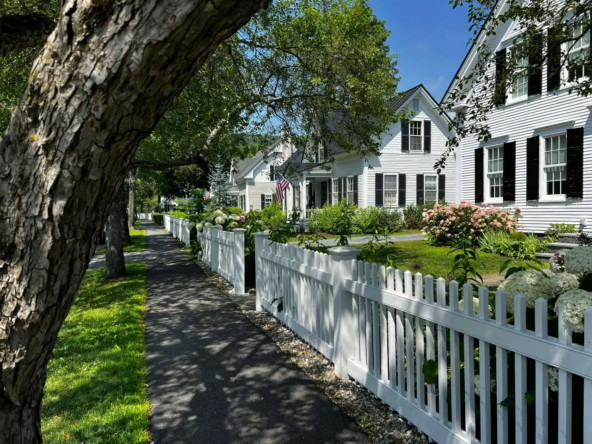
- You want character, older housing stock, and architectural variety — 1920s colonials, pre-war Tudors, gracious capes on tree-lined streets
- You value walkability and want to be able to walk to a train station, a coffee shop, and a grocery store from your house
- You are shopping above $3 million, where Wellesley’s inventory depth and prestige are unmatched in MetroWest
- You want the shortest possible commuter rail ride to Back Bay
- You are comfortable knowing that the town is actively protecting its existing housing stock rather than permitting rapid teardown-rebuild turnover
- You want to be part of the six-school neighborhood elementary structure with the brand-new Hunnewell and Hardy buildings
Choose Needham if:
- You want new construction or a recently built home — today’s active inventory is over 50% homes built 2015 or later, a far higher share than Wellesley
- You are shopping in the $1.5 million to $2 million range and want the most square footage and the most active inventory for your budget
- Your job is along the Route 128 corridor rather than downtown Boston
- You want a strong school district without a $2 million-plus price floor for entry-level single-family homes
- You are comfortable with a slightly longer commuter rail ride in exchange for more house
- You prefer a town that is slightly more relaxed and less overtly affluent in feel
Honest caveats on both lists:
- The Wellesley case is built partly on older housing stock. If you do not want to renovate a 1950s kitchen or deal with the quirks of a 100-year-old home, Wellesley becomes harder to shop — and the inventory of newer Wellesley homes in the $2M to $3M range is genuinely thin right now.
- The Needham case is built partly on new construction. If you specifically do not want a large new-build on a smaller lot and you want character instead, Needham still has older inventory — but your search will be narrower and you may end up looking at the same subset of homes for weeks.
What I tell clients who are torn is this: spend a Saturday driving through both towns. Not looking at specific listings — just driving. Go through Wellesley Square, Wellesley Hills, and Poets Corner. Then drive through Needham Center, Needham Heights, and the newer subdivisions off Great Plain Ave. You will feel which one fits your family within about two hours. The data in this article tells you what the market is doing. Your Saturday drive tells you what you want.
Frequently Asked Questions
Year-to-date 2026, the median single-family sale price in Needham is $2,359,500, compared to $1,897,500 in Wellesley. For the first time in at least five years, Needham’s median is running higher — a reversal of a long-standing pattern. Wellesley still commands a higher price per square foot ($605.68 vs. $544.37), so the reversal is less about Wellesley dirt losing value and more about Needham buyers purchasing larger, newer homes.
Yes. Needham is one of the top-ranked suburbs of Boston for families. Its school district earns an A+ from Niche, it sits directly on I-95 / Route 128 with commuter rail service to Back Bay in 30 to 35 minutes, and it has active conservation land, youth sports programs, and a walkable downtown. It has also been the single fastest-appreciating major MetroWest town for the last four years.
Needham’s median household income and home values place it firmly in the wealthiest tier of Massachusetts suburbs. In 2026 year-to-date, the median single-family sale price in Needham is $2.36M, which is higher than Wellesley, Newton, and Natick, and trailing only Weston among the commonly compared MetroWest towns.
About 15 miles by road, which is typically a 25 to 40 minute drive depending on traffic. By MBTA commuter rail, the ride from Needham to Back Bay is 30 to 35 minutes.
Yes. Both districts earn A+ ratings from Niche and rank among the top 15 school districts in Greater Boston. Wellesley operates six neighborhood elementary schools (Bates, Fiske, Hardy, Hunnewell, Schofield, and Sprague) and recently opened a $250 million new high school campus. Needham has a similar neighborhood-school model and matching academic reputation. The choice between the two should not be about district quality — both are excellent.
Needham, significantly. Of Needham’s 53 currently active single-family listings, 27 (51%) were built in 2015 or later. Of Wellesley’s 60 active listings, 19 (32%) were built in 2015 or later. The median year built on Needham active inventory is 2016; the median on Wellesley’s is 1969.
Part of the answer is policy. In 2017, Wellesley adopted a 12-month demolition delay bylaw for homes the Historical Commission deems worth preserving. Needham has a 6-month delay. Builders running teardown-rebuild projects generally prefer shorter delays because the carrying costs add up quickly, and Needham’s Historical Commission has publicly acknowledged that the 6-month window has not been long enough to deter teardowns. Over the last several years, new-construction activity has shifted toward Needham, which is now showing up in the resale inventory data.
Based on 2026 data, Needham. Needham has significantly more inventory in the $1.5M to $2M range (14 active listings vs. 4 in Wellesley), and Needham’s average listing price per square foot is lower. If you are shopping for maximum square footage and newer construction, Needham is the data-backed answer right now. If you are shopping for luxury above $3 million or for the most walkable village-center living, Wellesley remains the stronger choice.
Yes, though the 2026 data shows the market has softened relative to 2024. Wellesley still commands the highest per-square-foot pricing of any MetroWest town under $3 million, still holds a dominant position in the luxury market above $3 million, and still has the shortest commuter rail ride to Back Bay. The town’s deliberate preservation policy means housing stock turnover is slower than in comparable towns, which tends to support long-term price stability even in softer cycles.
Choosing Between Wellesley and Needham
The reason this comparison matters more in 2026 than it has in years is that the data has genuinely changed, and the assumption most buyers bring to the decision is now out of date. If the last thing you read about Wellesley and Needham was published in 2023, you are working from stale information. The towns have moved.
What has not changed is that both towns are excellent places to raise a family. Both have top-tier schools, both have commuter rail, both have engaged communities, and both have the kind of walkability and amenities that make Greater Boston MetroWest one of the most desirable places to live in the country. There is no wrong answer between them — only the right answer for your family, your budget, and what you actually want from a home.
If you are early in the process and want help thinking through which town fits your family, that is exactly what I do. I work in both towns every week, I live in Wellesley, and I have watched this market shift in real time. If you want honest, data-backed guidance rather than a sales pitch, let’s connect. You can also browse current listings on my Wellesley homes for sale and Needham homes for sale pages, or read my insider’s guide to buying a home in Wellesley if you are ready to start the process.
Here’s to finding your family’s next home — whichever town it turns out to be in.
— Sneha
Sneha Patel is a real estate advisor with Gibson Sotheby’s International Realty, based in Wellesley, MA. She is a Wellesley resident, parent, former PTO president at Sprague Elementary School, and active community volunteer. She specializes in helping families find homes across Wellesley, Needham, Newton, Dover, Weston, and Wayland. Get in touch | (781) 316-4800